Senior Solutions Architect – Redshift Specialist · AWS Current
Help AWS customers design, migrate and tune their analytics workloads on Amazon Redshift.
Senior Solutions Architect · Redshift · AWS
I'm Patrick Muller, a Senior Solutions Architect at AWS specializing in Amazon Redshift. I help customers design and scale their analytics systems. Before this role, I spent years building data pipelines with Glue, Athena, Spark and EMR. Lately I've been building projects with AI agents and sharing the process online.
Below is Slice & Dice, a small physics experiment you can play with. It tracks its own statistics as you roll.
Slice & DiceFair dice?
WebGPU · StartingDrag a die to pick it up. Let go to throw it.
Space rolls. Hand throws don't count.
WebGPU unavailable
This experiment draws the dice with WebGPU, which this browser doesn't support. Recent versions of Chrome, Edge and Safari do.
The physics and statistics still work without the 3D view. Press Run 1,000 rolls to roll the dice off-screen with the same engine.
The distribution
Sum of 2 dice · observed vs. exactThe statistics
Roll the dice to start the sample.
Hand throws appear on screen but don't count, because you could set a die down on the face you want. Energy is shown in simulation units, not real-world units.
Physics. Each die is a rounded cube with mass, rotational inertia, friction and bounce. I wrote a small physics engine for this page instead of using a library. It handles collisions with the floor, the walls and the other dice 240 times a second.
Rendering. The dice are drawn with WebGPU and custom shaders. The pips are shallow dimples drawn by the shader. A high-resolution shadow map creates the soft shadows, and the reflections come from a simulated photo studio with softbox lights.
Statistics. Every counted roll updates the histogram. A chi-square test compares the results with the exact odds for the number of dice you chose. Rare sums are grouped together so each group expects at least five rolls. Run 1,000 rolls uses the same engine in a background thread.
The numbers
In production since
2007First role: System Analyst, GVTAt AWS
8 yrsSupport → Specialist → Engineer → ArchitectCountries
3Brazil · South Africa · United StatesPublications & talks
5AWS Big Data Blog · Summit · YouTubeThe path
Help AWS customers design, migrate and tune their analytics workloads on Amazon Redshift.
Built and ran data pipelines in Python, AWS Glue, Amazon Athena and S3. They processed terabytes of data from many sources and included data quality checks.
Advised customers on big data architectures such as Data Mesh, Lake House and Kappa, built on Kafka, Kinesis, EMR, Glue, Athena and Redshift.
Troubleshot and tuned customers' production systems on EMR, Glue, DynamoDB, Elasticsearch, Kinesis, Kafka, Athena and Presto. Became an Athena subject matter expert.
Ran GCP and AWS environments and set up automation and monitoring for Kafka, Docker, Hadoop, Spark and Jenkins.
Managed WebLogic and Java systems on Oracle Exalogic and SuperCluster. Also consulted on big data projects with Hadoop, MongoDB, Splunk and Spark.
Managed WebLogic, Apache, Tomcat and JBoss servers and worked with early Hadoop (MapReduce, Hive, HBase). Supported billing and CRM systems on Oracle, PL/SQL, HP-UX and Solaris.
The work
Talk in Portuguese on embedded analytics with Amazon QuickSight.
Pinned on X. Part of an ongoing build-in-public series.
Side projects
The stack
Data & analytics
Languages & stores
AI & architecture
Credentials
Earned as an early adopter.
The person behind the pipelines
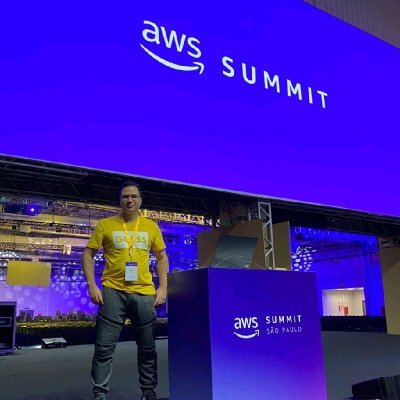
I'm Brazilian and work in both English and Portuguese. I've built data platforms in Curitiba, Cape Town and the United States. Beyond the technical work, I mentor teammates, run interviews, and turn team metrics into reports leaders can act on. I also share what I'm learning about AI.
Say hello